Tuesday, 29 October 2013

NOTE: Where Did It Go? - Metacoda's New Table Finder and Column Finder

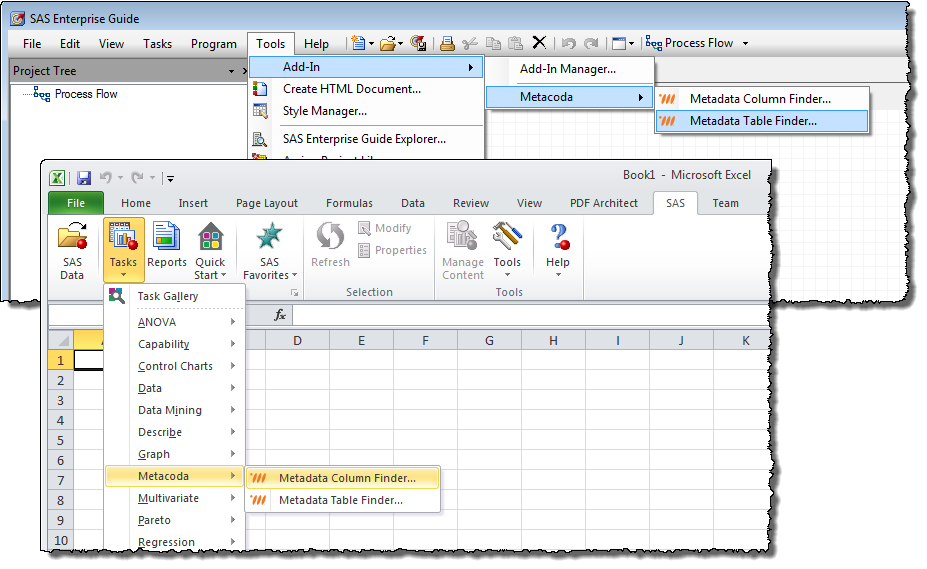
Metadata is supposed to help you organise and manage your data, right? And it does, to an extent, but metadata search utilities are few and far between, and not always available right where you want them. Metacoda recently released a pair of custom tasks for use in Enterprise Guide and the Add-In for Microsoft Office which go a long way towards resolving the situation.

The two custom tasks are:

Metadata Table Finder: search for a table from all of the tables registered in metadata

Metadata Column Finder: search for a column from all of the table columns registered in metadata

Both tasks allow you to type in a keyword or phrase relating to the table or column you’re looking for. They then search the SAS metadata and display the results, showing where the matching objects can be found. They search metadata rather than the dictionary tables and hence they find tables and columns in any metadata-defined library - even those which have not yet been assigned. Metadata permissions will naturally limit the scope of your search.

The custom tasks work equally well with versions 5.1 and 6.1 of Enterprise Guide and the Add-In for Microsoft Office.

Both custom tasks are free-of-charge to those registered with Metacoda. See the product page for more details on the custom tasks and a link to register with Metacoda.

These custom tasks are a welcome addition to any SAS practitioner's armoury.

Thursday, 24 October 2013

Data Viz Web Sites

I'm currently leading a procurement project for one of my regular clients. The client has a very valuable manufacturing monitoring system with a dashboard which allows the client's manufacturing staff to monitor production trends on a daily basis - picking up data from a variety of source systems along the product manufacturing lifecycle.

Whilst the client's products all meet their manufacturing specification limits (and, hence, are good to go the distribution channel and consumers), the dashboard uses statistical process control (SPC) rules to provide automatic warnings when one or more production processes are drifting away from their central point of operation. Hence, the client's staff get an early warning and can bring the process back on track before it ever goes wrong.

My client wants to make a step change in their capability with regard to a) ability to perform more complex statistical process control activity, and b) data exploration, analysis and visualisation for circumstances where the root cause of the process drift is not immediately apparent. The step change may require software tools that are more advanced and sophisticated than their current reporting tool can provide. Thus, I'm running a gap analysis of their requirements against their current technology, and I'll be running a product selection exercise if/when gaps are found.

It's an interesting context and an interesting challenge, and I'm looking forward to driving our progress over the next few weeks and months.

To get to the point...

Whilst reviewing the market for visualisation and analytics products, I came across this neat list of visualisation sites on the Guardian web site within their ever interesting Data Store section. None of them are products, so they're no real help with my client's needs, but they are a good source of visualisation ideas. Take a look and tell me what you think...


Of course, no mention of data visualisation is complete without a reference to Hans Rosling's fabulous treatise on health versus wealth for 200 countries over 200 years which I featured back in December 2010.

NOTE: EBI V4.4. Extra

Last week I wrote about what I'd learned about SAS Enterprise Business Intelligence (EBI) V4.4. at the recent SAS Professionals Roadshow.

I highlighted that traditional Web Report Studio reports will be available through the SAS Mobile BI app. Metacoda's Michelle Homes commented and added that the documentation says you don't have to perform any post-installation tasks to enable mobile reporting. That's great news. Thanks for reading the documentation on my behalf, Michelle!

There are just one or two types of Web Report Studio reports that cannot (yet) be surfaced via the Mobile BI app. These are documented at the link below (supplied by Michelle):

http://support.sas.com/documentation/cdl/en/biwaag/65229/HTML/default/viewer.htm#p1oo4k0eftlvipn1jm201adrl74n.htm

Wednesday, 16 October 2013

NOTE: Increasingly Agile

I'm a keen follower of SAS's adoption of Agile delivery techniques. I've posted articles on the subject in the past. You'll have noticed how SAS are releasing new version of Visual Analytics every six months; this is a good example of the benefits of Agile.

Since my earlier article, SAS's Tim Arthur has published a couple more articles on the subject. How is Being Agile Different From Doing Agile was published in July, and 5 Ways SAS Scaled Agile Scrum was published earlier this week. Both are highly informative regarding Agile in general and SAS's use in particular.

Tim intends to publish more information next month, so stay tuned!

Tuesday, 15 October 2013

NOTE: EBI V4.4

Last week I wrote-up some notes from part of the SAS Professionals Roadshow from earlier in October. Aside from the V9.4 update, I also attended the Enterprise Business Intelligence (EBI) update. Here are my notes:

  • V4.4 is the latest version
  • Google Chrome (and one or two other browsers) is now supported alongside Internet Explorer
  • It's worth noting that SAS/SECURE is now part of SAS/BASE and accessible to EBI
  • EBI integration is now available with the SAS Mobile BI app on Apple iOS and Google Android. The app can use relational web reports (srx) without the need for Visual Analytics (VA). OLAP is not currently supported, only relational reports. To use this feature, just login to the metadata server from the app, navigate the metadata folders to find your srx report, and subscribe to the report
  • In addition to mobile access to VA reports and relational srx reports, the Roambi relationship continues for 9.4
  • The BI Dashboard now remembers your last position and offers greater interaction with stored processes, i.e. a limited selection of prompts
  • Support for office 2013 (back to 2007) is provided
  • SAS Web Parts for Microsoft SharePoint now includes the ability to view of Web Report Studio srx reports, BI dashboards, stored processes, and VA reports 
  • Enterprise Guide 6.1 is new, yet it can be co-installed alonside 5.1
  • EG 6.1 has an improved scheduler with triggers and actions
  • EG 6.1 has a completely standalone installer - so there's no need to install it from a large depot
  • EG 6.1 supports SAS 9.2 onwards
All-in-all, a valuable session.

Wednesday, 9 October 2013

NOTE: A Stable Platform for 8 Years

Back in 2011, IBM announced their intent to purchase Platform Computing. You may recognise Platform Computing as the suppliers of SAS's solutions for scheduling (LSF) and grid management. At the time of the announcement it was not clear what the impact on SAS's relationship with Platform Computing might be.

The good news, I recently discovered, is that SAS signed a new 8 year deal with IBM and Platform Computing last year. So, we can rest assured that our investments in SAS's solutions for scheduling and grid management are secure and have a long-term perspective.

The functionality of Platform RTM, i.e. management of the SAS grid, has been built into the new SAS Environment Manager.