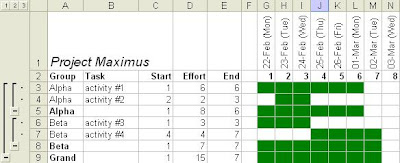
In the two previous posts in this series I described how to create a neat and simple Gantt chart and how to add dates to the day numbers. In this post I’ll describe how to groups your tasks in the chart that was featured in the previous post. The picture alongside (right) shows the end result from today's post. Grouping tasks is a generally useful thing to do, but I also find that my list of tasks increases as time goes by, so I might not need groups to begin with, but they become a useful way of keeping my plan tidy after it has grown.
As with the previous cases, I’m going to describe a quick and simple method. The objective is to have a useful and communicative chart without spending too long on creating it and without making it difficult to maintain. We start with the chart that was created in the last posting (shown to the left). Remember my comments in the first post in this series: I expect SAS developers to run their own (small to medium sized) projects from time-to-time, and I expect them to know how to work to a plan.
Let’s begin by adding a group column (inserted as column A, and then filled with appropriate values):
Select cells A2 to E6, i.e. the cells that have the column headers and our data. Launch the Subtotals window (in Excel 2002 it’s available from the Data menu). Use ticks to add subtotals to Start, Effort and End (in the summary rows we want to see summarised values for these three columns - yes, I know it's not appropriate to "sum" Start and End, just bear with me!):
When you click OK you’ll see that outlines have been added, and Start, Effort and End are being totalled (and sub-totalled). We need to change the “(sub-)totals” for start and end to show minimum and maximum instead (see, I asked you to bear with me!). Select column C and use Edit/Replace to replace “SUBTOTAL(9,” with “SUBTOTAL(5,”; and in column E, replace “SUBTOTAL(9,” with “SUBTOTAL(4,”. Finally, you might want to select column A and remove the word Total. The result looks like this:
Q: What was that stuff with changing subtotal 9 to subtotal 5 and 4?
A: Excel's subtotal function does more than subtotaling. The first parameter is a numeric code that tells the function what you want it to do. 9 indicates summarisation, i.e. adding-up, but 5 indicates you want to see the minimum value, and 4 indicates maximum value.
To finish our work we might a) Replace “Grand” in cell A9 with something more suitable such as “TOTAL”, and b) enhance our conditional formatting to make the (sub-)total rows look distinctive. We can spot them because the task name is blank in these rows. Thus we change the conditional formatting as shown below for cell G3 as an example (then just use Format Painter to spread it across the whole Gantt chart). Note the additional clause in the AND function of the first clause in addition to the extra condition:
And here’s the final result:
This series of three posts has shown how to quickly and easily create a simple Gantt chart. My objective has been to produce a neat, communicative chart without too much effort. In addition, the chart has to be robust and allow me to make changes (such as adding tasks or changing them) without disturbing the chart and requiring me to start from scratch. These charts demonstrate that the developer is in control of their project (without spending more time on planning than on delivering the goods).
If I'm working on a large enough project I sometimes add a couple of embellishments to the chart (given that the size of the project merits the extra effort involved). I like to highlight "today" and I like to track %done and show it on the pseudo-bars of the Gantt chart. I'll describe how to do this in a bonus post next week.
It is possible to use Excel charts to create a similar output. The chart can look more pretty than what we've achieved above, but I find that it can become unwieldy and difficult to read & print as the number of tasks grows. Hence, I choose to use the worksheet rather than a chart. I'll describe how to do this in a bonus post in a subsequent week.


