Showing posts with label BI. Show all posts

Wednesday, 2 September 2015

NOTE: SAS "Inside" of Hadoop

We previously looked at SAS Grid Manager for Hadoop, which brings workload management, accelerated processing, and scheduling to a Hadoop environment. This was introduced with the m3 maintenance release of SAS v9.4. M3 also introduced support for using an Oozie scheduling server.

If you're keen to get additional SAS services running on your Hadoop cluster, potentially reducing "data miles", you'll be pleased to know that SAS has an experimental feature in v2.7 of the LASR Analytic Server that allows us to experimentally manage resources with YARN. I need to stress "experimental" - this is not ready for our production systems quite yet, unless reliability & availability are not our top priorities.

If the experimental status doesn't put you off then you can find more details at the back of the LASR Analytic Server 2.7: Reference Guide.

YARN (Yet Another Resource Negotiator) is part of the base framework of version 2 of Apache Hadoop. It's a resource manager and it takes care of the Hadoop cluster's compute resources. YARN can manage and share resources between various applications. Configuring LASR to participate in YARN's resource sharing allows YARN to have a complete picture of activities on the cluster.

The use of YARN with LASR is part of the increasing integration between SAS and Hadoop. I look forward to seeing it move to "general availability" status.

Tuesday, 1 September 2015

NOTE: Visual Analytics V7.3 Has Arrived

Maintenance release 15w33 of SAS v9.4 arrived in August and it included a new version of Visual Analytics - version 7.3. This new release doesn't offer significant new features over its previous releases but I did notice that Visual Analytics Viewer's default appearance is now MODERN instead of CLASSIC. This is related to VA's transition from Flash to HTML5 technology - something I mentioned back in July.

I did also notice that VA v7.3 comes with an option to allow us to print the entire content of tables, crosstabs, gauges, and containers with content that is only partially available in the layout of the report section. I'm sure that'll be handy on occasions - especially for those of us with small screens!

Wednesday, 22 July 2015

NOTE: HTML 5 is in VA Hub Already!

Aside from comments about my SAS Enterprise Guide vs SAS Studio article, Metacoda's Michelle Homes (@HomesAtMetacoda) was quick to write a comment about my Flash & SAS Visual Analytics (VA) article and to point out that HTML5 is already an option for the VA Hub. Michelle said:
HTML 5 has been available as a configurable option in the hub in SAS VA 7.1 which was released in October 2014. Some information on this can be found at https://communities.sas.com/docs/DOC-8254

SAS VA 7.2 has a nice HTML 5 hub by default.
As a Session Recap from a SAS Live Q&A session states (along with nice comparison screenshots):
in Visual Analytics 7.1, the Home Page can be displayed using Flash or HTML5. Someone who has the Visual Analytics: Administration role can change the vah.client.ui.mode property in SAS Management Console. On the Plug-ins tab, navigate to Application Management --> Configuration Manager --> SAS Application Infrastructure --> Visual Analytics. Right-click the node and select Properties to access Advanced properties. The vah.client.ui.mode property specifies which mode of the Home Page to use. The default value, classic, specifies to use Flash to display the Home Page. The alternate value, modern, specifies to use HTML5 to display the Home Page. Note that the vah.client.ui.mode property is a site-wide setting that affects all users.
To learn more about SAS VA Mobile BI and HTML5, the TechTalks video of Himesh Patel (Sr Director, Research and Development) from this year's SAS Global Forum is a good place to start.

Tuesday, 30 June 2015

More Flash in Chrome for Less Power ... and the HTML5 Migration

If you use one of SAS's web interfaces you'll be a great fan of the flexibility and usability of the user interface. And those capabilities are probably provided by Adobe Flash. Your browser is running the Flash plug-in.

But Flash has one or two downsides, principally its tendency to use lots of CPU cycles which in-turn uses lots of battery power. Not a problem maybe if you're hooked to the mains, but not good on a laptop of mobile phone/tablet.

If you use the Chrome browser you'll be pleased to hear that Google are improving Chrome's power consumption when Flash is running. When you’re on a webpage that runs Flash, Chrome will intelligently pause content, e.g. Flash animations, that aren't central to the webpage, while keeping central content (like a video) playing without interruption. If Chrome accidentally pause something you were interested in, you can just click it to resume playback. This update significantly reduces power consumption, allowing us to do analytics on-the-go for longer before having to hunt for a power outlet.

This feature was enabled by default on Chrome’s desktop Beta channel in June, and will be rolling out soon to everyone else on Chrome desktop.

Looking longer-term, SAS are replacing their use of Flash with HTML5. Whilst the use of Flash requires a plug-in from Adobe, HTML5 is supported by all modern browsers out-of-the-box, with no need for any plug-in. The majority of web sites and vendors are migrating to HTML5 due to its net neutrality and power-consumption benefits. SAS Studio already uses HTML5; Visual Analytics and Visual Statistics currently use Flash. We can expect a migration to HTML5, perhaps starting with the VA hub this summer, which will probably be complete next year.

Monday, 20 January 2014

Business Intelligence (BI) Evolution

I recently stumbled upon an interesting series of papers from IBM. There're entitled Breaking Away With Business Analytics and Optimisation. The informative and deep-thinking series talks about the need for data and good analytical processes, but it also highlights the need for a vision and a focus for our activities; IBM describes this as "breakthrough ideas". I interpret it as meaning the creation of competitive advantage, i.e. doing something better than the competition.

One particular paper in the series that caught my attention was Breaking away with business analytics and optimisation: New intelligence meets enterprise operations. Page 3 of this paper contains a neat new interpretation of the traditional BI evolution diagram. I've shown IBM's diagram above.

Traditionally the BI evolution diagram shows evolution from historic (static) reporting, through data exploration and forecasts, to predictive models and real-time systems, i.e. a gradual transition from "rear-view mirror" reporting to influencing the future. The IBM diagram contains more dimensions and focuses on the drive to achieve competitive advantage ("Breakaway"). Nice. This diagram certainly earns a place alongside the traditional form.

Tuesday, 14 January 2014

NOTE: Thoughts on Lineage

I got quite a lot of interested feedback on the BI Lineage post I made last week. My post highlighted a most informative article from Metacoda's Paul Homes.

Paul himself commented on my post and offered an additional tip. Here's what Paul said:
I agree it would be nice if BI developers could do their own scans without relying on unrestricted admins to do them ahead of time. This would be similar to how DI developers can do their own impact analysis for DI content in SAS Data Integration Studio. Ideally, as with DI, they could be done dynamically, without having to do a scan and have a BI Lineage custom repository to store them in.

In the meantime, one tip I'd suggest to make it easier for the BI developers, is that BI Lineage scans can also be scheduled. An unrestricted admin can schedule a scan, at a high level in the metadata tree, to be done every night for example.
A useful tip indeed. Thanks Paul.

Monday, 13 January 2014

2014, The Year of Personal Data

If 2013 was the year of wearable, personal devices then 2014 will be the year of personal data. In 2013 we saw a huge rise in popularity of wearable devices for measuring steps walked, distance travelled, pulse, calories consumed, and a lot more besides. These devices, and the smartphone, PC and cloud software that accompanied them, put us on the first few rungs of the business intelligence lifecycle - principally allowing us to do historic reporting.

I believe 2014 will see a great evolution of our use of personal data. Rather than the "rear view mirror" historic reporting that we've seen in 2013, we'll see software that predicts your future activity and offers advice and recommendations on how to positively influence your outcomes. It's not beyond the bounds of possibility for your smartphone to start prompting you to go for a walk lunchtime in order to meet your weekly target for steps, or consume no more 400 calories at dinner in order to avoid bursting your weekly calorie target. And those are just simplistic examples.

As an example of the lengths to which you can go to perform data mining on your personal data, I highly recommend the recent report in Wired of the astrophysicist who diagnosed himself with Crohn's disease. A fascinating story.

Tuesday, 7 January 2014

NOTE: Broadening Access to the BI Lineage Plug-In

Metacoda's Paul Homes recently wrote a most informative article entitled Providing User Access to the SAS BI Lineage Plug-in. As Paul says in his article, the BI Lineage plug-in can be used to do impact analysis for BI content (reports, information maps etc.) in a similar way that SAS Data Integration Studio provides impact analysis for DI content (jobs, tables, etc).

The plug-in was new with the November 2010 release of V9.2. Its results include lineage and reverse lineage, i.e. predecessor and successor objects.

Developers find this information useful in order to understand the impact of changing an information map (for example) on reports and, contrary-wise, it is useful for understanding what BI objects (such as information maps) will need to be changed in order to add a new column to a report. This information is useful to capture the full scope of a proposed change and hence to more accurately estimate the effort required.

Testers also find this information useful because it helps to gives them a gauge of the amount of coverage their testing is achieving (this week's theme on NOTE:!).

Paul describes how to make lineage reports viewable by any authorised user, but he concludes that only a strictly limited set of users can create the reports, i.e. what SAS calls "unrestricted users". This a shame because the functionality is of broad interest and value. Let's hope that SAS makes the creation of lineage reports more accessible in future. If you agree, hop over to the SASware ballot community and propose the enhancement. If you're unfamiliar with the ballot, read my overview from August 2012.

In addition, the ability to join lineage reports for BI and DI objects would provide the full provenance of data items. Now that's something I'd love to see!

Thursday, 24 October 2013

Data Viz Web Sites

I'm currently leading a procurement project for one of my regular clients. The client has a very valuable manufacturing monitoring system with a dashboard which allows the client's manufacturing staff to monitor production trends on a daily basis - picking up data from a variety of source systems along the product manufacturing lifecycle.

Whilst the client's products all meet their manufacturing specification limits (and, hence, are good to go the distribution channel and consumers), the dashboard uses statistical process control (SPC) rules to provide automatic warnings when one or more production processes are drifting away from their central point of operation. Hence, the client's staff get an early warning and can bring the process back on track before it ever goes wrong.

My client wants to make a step change in their capability with regard to a) ability to perform more complex statistical process control activity, and b) data exploration, analysis and visualisation for circumstances where the root cause of the process drift is not immediately apparent. The step change may require software tools that are more advanced and sophisticated than their current reporting tool can provide. Thus, I'm running a gap analysis of their requirements against their current technology, and I'll be running a product selection exercise if/when gaps are found.

It's an interesting context and an interesting challenge, and I'm looking forward to driving our progress over the next few weeks and months.

To get to the point...

Whilst reviewing the market for visualisation and analytics products, I came across this neat list of visualisation sites on the Guardian web site within their ever interesting Data Store section. None of them are products, so they're no real help with my client's needs, but they are a good source of visualisation ideas. Take a look and tell me what you think...


Of course, no mention of data visualisation is complete without a reference to Hans Rosling's fabulous treatise on health versus wealth for 200 countries over 200 years which I featured back in December 2010.

NOTE: EBI V4.4. Extra

Last week I wrote about what I'd learned about SAS Enterprise Business Intelligence (EBI) V4.4. at the recent SAS Professionals Roadshow.

I highlighted that traditional Web Report Studio reports will be available through the SAS Mobile BI app. Metacoda's Michelle Homes commented and added that the documentation says you don't have to perform any post-installation tasks to enable mobile reporting. That's great news. Thanks for reading the documentation on my behalf, Michelle!

There are just one or two types of Web Report Studio reports that cannot (yet) be surfaced via the Mobile BI app. These are documented at the link below (supplied by Michelle):

http://support.sas.com/documentation/cdl/en/biwaag/65229/HTML/default/viewer.htm#p1oo4k0eftlvipn1jm201adrl74n.htm

Tuesday, 15 October 2013

NOTE: EBI V4.4

Last week I wrote-up some notes from part of the SAS Professionals Roadshow from earlier in October. Aside from the V9.4 update, I also attended the Enterprise Business Intelligence (EBI) update. Here are my notes:

  • V4.4 is the latest version
  • Google Chrome (and one or two other browsers) is now supported alongside Internet Explorer
  • It's worth noting that SAS/SECURE is now part of SAS/BASE and accessible to EBI
  • EBI integration is now available with the SAS Mobile BI app on Apple iOS and Google Android. The app can use relational web reports (srx) without the need for Visual Analytics (VA). OLAP is not currently supported, only relational reports. To use this feature, just login to the metadata server from the app, navigate the metadata folders to find your srx report, and subscribe to the report
  • In addition to mobile access to VA reports and relational srx reports, the Roambi relationship continues for 9.4
  • The BI Dashboard now remembers your last position and offers greater interaction with stored processes, i.e. a limited selection of prompts
  • Support for office 2013 (back to 2007) is provided
  • SAS Web Parts for Microsoft SharePoint now includes the ability to view of Web Report Studio srx reports, BI dashboards, stored processes, and VA reports 
  • Enterprise Guide 6.1 is new, yet it can be co-installed alonside 5.1
  • EG 6.1 has an improved scheduler with triggers and actions
  • EG 6.1 has a completely standalone installer - so there's no need to install it from a large depot
  • EG 6.1 supports SAS 9.2 onwards
All-in-all, a valuable session.

Friday, 7 June 2013

NOTE: Reporting Horizontally (WRS tabs)

I recently spotted a neat tip from Tricia Aanderud on the BI Notes blog. In the article Web Report Studio: Switch Report Sections to Tabs in Snap! Tricia provides us all with a reminder of the ability to create tabs in our Web Report Studio reports and thus save our users from having to scroll down and down and down a report to find the table or chart that they're interested in.

Whilst the content (and quality thereof) of our reports is the most important aspect of our reports, the presentation and accessibility often comes a close second. If your reports are not attractive and easy to navigate and use then your content won't be seen.

Tuesday, 28 May 2013

NOTE: Adding Value to Your Metadata with Metacoda Commutual

I'm always glad to meet-up with the folks from Metacoda when I attend SAS Global Forum. They always have something new and valuable to show. Historically it's always been new features for their Metacoda Security Plug-Ins, but this year they were keen to talk about Metacoda Commutual.

The Metacoda Security Plug-Ins are add-ons for SAS Management Console which improve the productivity of administrators working on SAS metadata security. They provide clearer views of your security ACTs and ACEs together with the access that your security rules are giving to groups, roles and users. Over the years, the Plug-Ins have grown into a powerful and valuable tool.

First mentioned on this blog back in November last year, Metacoda Commutual is a web application for searching and collaborating around business and technical metadata in SAS, including discussions and notification of changes to items of interest. As I said in November, "I think the idea has great merit. Metadata is not just a technical thing; it represents the objects that are important to our business."

The Metacoda web site has a lot more information on Commutual, here’s a quick summary of the main focus areas of the new product:
  • Activity: get notified about any changes and discussions on items of interest to you

  • Search: find the items you want and register your interest in seeing activity for them

  • Discussions: share your knowledge and learn from the knowledge and experience of others

  • Easy Access: get easy access from anywhere: browsers on desktop PCs, tablets, or smart phones, and even custom applications, add-ons, and plug-ins

  • Performance: to make it as fast as we can, so you can find what you need, when you want it, and don’t miss out on shared knowledge because it takes too long or it’s too hard to find

  • Security: only provide access to metadata you normally have access to
Metadata is not just a means to an end from a technical perspective. Your BI reports and DI jobs are important to you and your business; recording and sharing extra information about these objects is of great value. I think Commutual has great value. What do you think?

[UPDATE. Metacoda have posted a video demonstration of Commutual, so you can see it in action]

Monday, 26 November 2012

NOTE: Getting Social With SAS Metadata

I noticed a most intriguing post on Paul Homes's Platform Admin blog recently. Do you and your colleagues discuss your metadata often? Paul thinks you should, and I'm inclined to agree.

This isn't a new or unique idea. SAS were talking about a collaboration framework at this year's SAS Global Forum, and I wrote a brief post about it. The idea of having a platform to facilitate business-like discussions that are focused upon specific business objects such as web reports, information maps, tables, stored processes and cubes seems to hold value.

You'll recall that Paul runs Metacoda Pty Ltd, providers of SAS services plus the excellent Metacoda Security Plug-Ins for viewing your SAS security metadata and rules. Well, Metacoda are now in the final stages of development of a new product to facilitate discovery and discussion of your metadata.

Fundamentally, the Metacoda product (which doesn't seem to have a name yet) will provide:
  • Activity: get notified about any changes and discussions on items of interest to you
  • Search: find the items you want and register your interest in seeing activity for them
  • Discussions: share your knowledge and learn from the knowledge and experience of others
  • Easy Access: get easy access from anywhere: browsers on desktop PC’s, tablets, or smart phones, and even custom applications, add-ons, and plug-ins
  • Performance: to make it as fast as we can, so you can find what you need, when you want it, and don’t miss out on shared knowledge because it takes too long or it’s too hard to find
  • Security: only provide access to metadata you normally have access to
I think the idea has great merit. Metadata is not just a technical thing; it represents the objects that are important to our business. Paul is seeking collaboration with enterprises who might be able to make immediate use of Metacoda's new tool. If your interest is piqued, get in touch with Paul via the link at the bottom of his post.

Monday, 19 November 2012

NOTE: Clean Your Cubes

It's not spring-time, but it's still worth giving a thought to the cleanliness of your environment, for the benefit of reducing complexity and of reducing space usage. Angela Hall posted a great article about Cleaner OLAP Cube Physical Folder Structures earlier this month on SAS's Real BI for Real Users blog.

In her article, Angela gave a "below the water line" view of OLAP cubes and how they are maintained and stored. Her tips for cube rationalisation will reduce disk space usage and improve performance. Well worth a look.

Thursday, 1 November 2012

NOTE: SAS Mobile BI on Android

I see that SAS Mobile BI is now available for download from the Google Play store for Android-loving folk like myself. This is in addition to its earlier Apple incarnation. It's good to see SAS keeping to its promise of supporting multiple platforms.

It only appeared yesterday, so there's not been many downloads yet, but I'll follow its popularity with interest. It's a shame I don't have a SAS server I could test it from.

Tuesday, 18 September 2012

Whatever You Call It, It's All About People First

Achieve Intelligence (AI) just published its latest monthly news article. AI's monthly publications are all themed on building your Business Intelligence (BI) strategy. This month's publication is entitled "Capability Improvement – The Three P’s" and it describes the importance of people, process and plumbing in your strategy.
AI's monthly publications are long-overdue a mention in NOTE: because they are written by a team of people who have "got the T-shirt" in addition to going "there" and seeing "it"; plus, the publications are written in bite-sized chunks so you can take an actionable nugget of information from each monthly publication. Similar to NOTE:, you can visit the web site monthly, or you can request a convenient monthly email. I've not yet found a means to subscribe through RSS (many NOTE: readers use this approach).
Past publications from AI have included:
  • Why do I need a Business Intelligence Strategy?
  • How to Create a Business Intelligence Strategy
  • Reasons for chaos: before a Business Intelligence Strategy
  • Five Areas of Business Intelligence Strategy
  • Stakeholder Management
AI's topic this month is one that I visited myself a couple of years ago. In "Keys to Success: People, Process, Technology", I wrote about how people are the most important factor in the success of any endeavour, closely followed by the business processes that the people use to achieve their goals. I refer to the final element as "technology", AI prefers "plumbing", but our message is the same... no project or strategy can focus on technology alone.

If you'd like to receive some advice and challenges about BI strategy each month, subscribe to AI. Better still, invite them to visit you and discuss your BI strategy. You do have a clearly-expressed BI strategy, don't you?...

Monday, 10 September 2012

NOTE: True Self-Service BI With Futrix

Over the last couple of weeks I've featured a couple of 3rd-party SAS-related products (Metacoda security plug-ins and Phil Holland's Ebook/apps). I've said how much I support 3rd-party products. So, I couldn't let this unintentional mini-series end without including the Daddy of them all: Futrix.

Futrix's ability to let its users drill up, down, and across without being constrained by cube definitions or data hierarchies is one of the key attractions of this SAS-based Business Intelligence (BI) tool that has been around since 1997. The ease with which novice users can pick up and use Futrix belies other vendors' claims to ease-of-use. Futrix is ease-of-use personified.

But don't think that ease-of-use equals limited-in-ability. Aside from the ability to drill anywhere (including jumping from one table or cube to another whilst preserving your drill-level), Futrix allows dynamic grouping (for creating categorisations on the fly) and user-defined formulas. The information can be presented in a mixture of tables, charts and dashboards.

Beneath the user interface there's a sophisticated set of administrative tools that include a full security model and the ability to allow Futrix to dynamically tune cubes and its own aggregations.

Product development is rapid, and influenced by customer feedback.

Take a look at the web site, take-up the offer of a free trial demonstration, and take your SAS-based data to a whole new audience!

Monday, 20 August 2012

NOTE: BI Testing

I recently spotted a valuable posting from SAS's Angela Hall on her Real BI for Real Users blog. I hesitate to suggest it was valuable because that implies her other posts are of less value! Not true, but this particular article was titled Testing recommendations for SAS BI Dashboard & SAS Web Report Studio and, with its structure following the data flow of a BI report, it offered a comprehensive check-list and set of suggestions for end-to-end testing of your BI reports.

Testing delivers confidence not guarantees, and Angela's posting offers advice on how to decide what amounts of testing are appropriate for you.

SAS technology is easy to work with and provides quick and efficient tools for getting your results quickly, but it cannot prevent its users from making mistakes. Beware of using the ease and efficiency of SAS technology to produce the wrong results quickly. As Angela says in her posting, "the most important thing is to do SOME testing of your reports"; that has to be the most valuable piece of advice in the posting!

Monday, 13 August 2012

NOTE: Farewell to London 2012 #London2012

This week is going to feel strange. "London 2012" will revert to simply being a reference to London in the year 2012 AD. Since the 2012 Olympics were awarded to London on 6th July 2005, the phrase "London 2012" has held special meaning and anticipation for us Brits.

The last few weeks have been one long celebration for Londoners. Aside from some fabulous sport and competition, London has benefited from a multitude of cultural activities and events. Coming so soon after the celebrations for The Queen's Diamond Jubilee, I've forgotten what London is like in "ordinary" times.

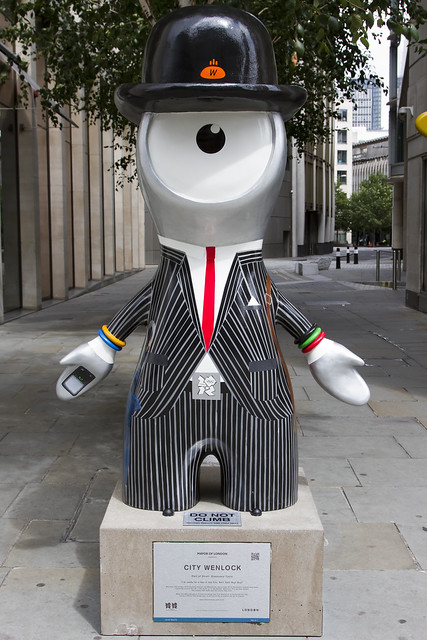
On my journey to and from my London office, and meeting friends and colleagues around London, I've seen plenty of Wenlock and Mandeville statues in a variety of costumes; a smartly suited gentleman with a flowerpot head walking around London Bridge railway station; London 2012 bunting everywhere; friendly greetings from every one of the many, many Olympic volunteers I came across; and had my hand shaken by a member of the Ood upon my arrival at London Charing Cross railway station!

I was immensely grateful for the 24 (yes, count them, 24!) BBC TV channels, showing every minute of every sport live in High Definition quality. I'm now looking forward to the start of the Paralympics. I've got tickets for one of the paralympic equestrian events (no jokes about horses in wheelchairs, please) and I'm desparately fighting the Olympic ticket web site to get tickets for the athletics. Wish me luck!

Anyway, ... the Olympics have brought smiles and cheer to Londoners, but they have also delivered a deluge of data and information. So, to round-out London 2012, I thought I'd round-up some of the best SAS-related Olympic data articles:

Graphs of Olympic proportions!, by Rob Allison

Data visualization of funding of 2012 Olympics, by Charles Pirrello

Watching the London Olympics on my smartphone - Now this is BIG DATA, by Ken King

Summer Olympics 2012 – athlete analytics with JMP, by Daniel Valente

The articles contain a nice mixture of graphics, finances, and statistics. If there was an Olympics for SAS practitioners, what event would you be entering?...

Now we have the paralympics to look forward to...