I was interested to see that FORTUNE has ranked SAS as number one best company to work for in America. FORTUNE lists child care, health insurance, and the Cary campus's medical centre & fitness centre as just some of the reasons for SAS's top result. For those of us that don't work for SAS this is still good news because we can rest assured that new versions of the software are being developed by happy and motivated staff. As Mikael Hagström (Executive Vice President, EMEA and Asia Pacific) says in his blog, SAS's focus on its staff ensures that it is able to "continue to attract top talent and domain experts".
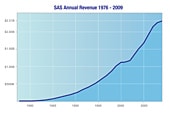
Also on the radar for those who have invested in SAS software: SAS have reported revenue growth of 2.2% (to $2.31 billion) in 2009. Whilst this is a lot less than the fabled "double digit growth" that SAS have achieved for most of their 34 year history, it's still a good performance in the current market conditions. Indeed, in some markets, such as retail, double-digit growth has actually been achieved. However, a note of caution is required. The Bankers' Mantra says "turnover is vanity, profit is sanity". I've not seen any published profit figures (as a private company SAS are not obliged to publish any), so we can't be sure at what cost the increased revenue was produced.
"We live in a global economy," said SAS Senior Vice President Jim Davis. "Not everyone is turning the corner at the same time. In 2010, we need to realise where the opportunities lie and how to approach those opportunities based on whether that particular region is seeing the light at the end of the tunnel."
SAS® and software development best practice. Hints, tips, & experience of interest to a wide range of SAS practitioners. Published by Andrew Ratcliffe's RTSL.eu, guiding clients to knowledge since 1993
Tuesday 26 January 2010
NOTE: IFC and IFN, the New IF
Have you discovered SAS V9.1's new IF functions yet: IFC and IFN? They don't provide any functionality that you couldn't achieve in V8 (nor V6 nor V5 nor...) but they could make a big change to your SAS coding style.
NOTE: Creating Multi-sheet Microsoft Excel Workbooks
The fourth seminar in SAS's SAS Talks series was held last week. I need to get myself onto the right distribution list because I didn't find out about it until after the event :(
This event was lead by SAS's Vince DelGobbo and focused on providing an introduction to creating multi-sheet Microsoft Excel workbooks with SAS. It's a topic that Vince has presented at various forums before, e.g. PharmaSUG 2007, SUGI 31 and NESUG 09, but still contemporary nonetheless.
Tuesday 19 January 2010
NOTE: WHEREUP=
I was introduced to the WHEREUP data set option recently. In counterpoint to a WHERE data set option, WHEREUP allows you to control what records are written out (as opposed to WHERE's control of what's read in). WHEREUP can be set as YES or NO and it specifies whether or not records to be written out must match the WHERE clause.
The WHERE clause always applies to input observations, and the step reads only observations that meet the condition. With WHEREUP=YES, it does not allow the observations to be changed so that they no longer meet the condition. With WHEREUP=NO, it is possible to change data values so that observations no longer meet the WHERE condition.
NOTE: Enterprise Guide Add-Ins
In a recent post on his SASdummy blog, Chris Hemedinger featured some add-ins for Enterprise Guide 4.1 that allow import and export of files from JMP, Stata and SPSS. These were written by Chris (using PROC IMPORT and EXPORT) and are available for download. These add-ins are not supported, but the same functionality will be shipped with EG 4.2 - supported.
Chris's post left me wondering how many other EG add-ins might be available "off the shelf" on the web. Ideally for free!
Wednesday 6 January 2010
NOTE: Marimekko - Using PROC GAREABAR in V9
I stumbled across an interesting new style of chart the other day (it was new to me, it may not be new to you). The Marimekko chart shows three levels of data within a simple 2D representation. Indeed, by stacking the bars in the chart, one can achieve four levels of data. I found the chart in a (long) article explaining how to create Marimekko charts in Excel; I was pleasantly surprised to find that SAS has a PROC (since V9) for creating these charts: PROC GAREABAR.
Rob Allison shows a good example of usage of these charts on his web site. Rob takes a USA energy chart that was featured in the Junk Charts blog. The chart is successful in demonstrating the prevailing dependance on oil for transport and coal for electricity. Of course, Stephen Few has thoughts on the strengths and shortcomings of Marimekkos. He offers his thoughts in A Design Problem on his blog. Briefly, he agrees that the chart has merit and can communicate useful messages, but he concludes that the better option is to provide multiple, simpler charts on one canvas. Of course, SAS can do this too, so it's good to see that SAS practitioners can benefit from Stephen's advice.
Two points worth noting are:
The name Marimekko is derived from a style of clothing design made popular by the Finnish company of the same name.
Rob Allison shows a good example of usage of these charts on his web site. Rob takes a USA energy chart that was featured in the Junk Charts blog. The chart is successful in demonstrating the prevailing dependance on oil for transport and coal for electricity. Of course, Stephen Few has thoughts on the strengths and shortcomings of Marimekkos. He offers his thoughts in A Design Problem on his blog. Briefly, he agrees that the chart has merit and can communicate useful messages, but he concludes that the better option is to provide multiple, simpler charts on one canvas. Of course, SAS can do this too, so it's good to see that SAS practitioners can benefit from Stephen's advice.
Two points worth noting are:
- SAS V9.2 introduced some extra parameters to PROC GAREABAR. This includes the LEGEND option used in Rob Allison's code. To use Rob's code in V9.1, just remove the LEGEND option
- PROC GAREABAR currently only works with two graphics devices: ACTIVEX and ACTXIMG
The name Marimekko is derived from a style of clothing design made popular by the Finnish company of the same name.
Monday 4 January 2010
NOTE: EG The Movie
Happy New Year!
In an earlier posting I mentioned the SAS Talks session on Enterprise Guide scheduled for December 17th. If, like me, you missed it, you can catch-up with the recorded version (and answers to those questions that were not immediately provided during the recording). See Chris Hemedinger's recent post on his SAS Dummy blog.
SAS Talks is SAS's ongoing series of webinars on technical topics. Unfortunately I can't find a "home page" where I can find a) notice of upcoming webinars, and b) previous webinars and their materials all in one place. Is there one?...
Subscribe to:
Posts (Atom)