Monday 31 December 2012

Bletchley Park - Birthplace of the Modern Computer

I enjoyed a visit to Bletchley Park with my kids on Saturday. It's an amazing place. It just reeks of World War II and the Cold War. And it has so many fascinating stories to tell. The place was abuzz with the latest news - that 92 year old Bletchley codebreaker Raymond Roberts had been appointed an MBE in the New Years honours list.

Bletchley's activities are reckoned to have shortened WW II by 2 years, yet nobody but a select few knew what was done there until the mid-1970s when the Official Secrets Act restrictions were lifted. Such was the secrecy that husbands and wives did not know that they each had worked at Bletchley in their younger days until they cautiously mentioned their past to each other in the mid-1970s.

Bletchley Park (near Milton Keynes, in Buckinghamshire) was Britain's main decryption establishment during WW II; the home of the Government Code and Cipher School (GC&CS), known as the Golf, Chess and Cheese Society by outsiders who can have had no idea of the work truly going on at Bletchley. Ciphers and codes of several Axis countries were decrypted including, most importantly, those generated by the German Enigma and Lorenz machines. This was achieved in equal measure by brainpower and by the invention and use of Colossus - the world's first electronic, digital, fixed-program, single-purpose computer . The secrecy around Bletchley's activities meant that the Axis countries were unaware that their seemingly unbreakable codes had indeed been broken and British military commanders and politicians were reading Axis messages within hours of them being sent.

A senior member of the Bletchley war-time team was Alan Turing. Turing was part of the team that cracked the Nazi Enigma code, vital to the allied war effort. He is now widely recognised as a computing pioneer. However, at the time of his death - which an inquest recorded as suicide - he was virtually unknown to the public. His work at Bletchley Park was kept secret until 1974.

2012 celebrated 100 years since Turing's birth. There's a wonderful sculpture of Turing at Bletchley, made entirely of pieces of slate by Stephen Kettle. The picture I've shown here doesn't do it justice. It's well worth a trip to Bletchley just to see this sculpture. Amazing work!

The Automatic Computing Engine (ACE) was the product of Turing's theoretical work in 1936 "On Computable Numbers" and his wartime experience at Bletchley Park with Colossus. In early 1946, Turing presented a detailed paper on ACE to the National Physical Laboratory (NPL) Executive Committee, giving the first reasonably complete design of a stored-program computer. However, the Official Secrets Act prohibited him from explaining that he knew that his ideas could be implemented in an electronic device. ACE implemented subroutine calls and used Abbreviated Computer Instructions, an early form of programming language. Turing's colleagues at the NPL, not knowing about Colossus, thought that the engineering work to build a complete ACE was too ambitious.

Turing was a homosexual, at a time when homosexuality was illegal in Britain. Turing was convicted of gross indecency in 1952 after acknowledging a sexual relationship with a man. Barbaric as it seems by modern standards, he was offered (and accepted) treatment with female hormones ("chemical castration") as an alternative to prison. Turing died in 1954, from cyanide poisoning. An inquest determined that his death was suicide. An incredibly tragic life story.

In 2009, Prime Minister Gordon Brown made an official public apology on behalf of the British government for "the appalling way he was treated". In 2012, there has been a growing campaign to grant Turing a statutory pardon. In a letter to the Daily Telegraph on 14th December, eleven of Britain's leading scientists called on the government to grant the pardon.

I'm looking forward to receiving my copy of Dr Sue Black's Saving Bletchley Park book later this year, describing the amazing people and amazing work done at Bletchley over the last 70 years, including efforts in recent years to stop the bulldozers and save the site for the nation.

The BBC History web site has a wonderful section on Bletchley (including video). Bletchley Park is highly recommended for a visit, and so is the BBC web site!

Thursday 27 December 2012

NOTE: UK Events, Good News and Bad News!

Good news 1: SAS UK will be running Analytics 2013 in London on 19th and 20th June. This is part of a series of such conferences, its predecessor being held in Cologne, Germany last June. The 2012 conference included Data Mining, Forecasting, Text Analytics, Fraud Detection, Data Visualisation, Predictive Modeling, Data Optimisation, Operations Research, Credit Scoring, and High-Performance Analytics. A wide varity of analytics topics! I'm sure the 2013 conference will be well worth attending.

Good news 2: There will be a series of 'SAS Professionals road shows' early in 2013. I've long extolled the virtues of the annual SAS Professionals Convention held in Marlow. Now you don't even need to travel as it comes to you! Keep checking the SAS Professionals web site for details when they appear.

Bad news: There isn't any really. There won't be a full-blown SAS Professionals Convention in 2013, but with all of the above, it's no great surprise, and nobody is a loser.

Your "2012" Top Ten

It's traditional at this time of year to look back over the year and pull out some highlights. I thought I'd take the easy route here and publish a list of the ten most viewed articles published this year. However, I realised that this would be skewed in favour of older articles. So, in an effort to bring balance, I decided to look at the posts I'd published in the last 18 months and highlight the ten most viewed. And when I come to do that in a years time, the last half of 2012 will get its fair crack of the whip. Does that make sense?

Anyway, here they are (with the most popular at the top of the list)...
  1. NOTE: SAS Global Forum (SGF) 2012 Call For Papers, 18-Oct-2011
  2. NOTE: Keyboard Shortcuts in the SAS Enhanced Editotor, 23-Aug-2011
  3. NOTE: Booked for SAS Global Forum 2012, 03-Jan-2012
  4. NOTE: DS2. Data Step Evolved?, 02-May-2012
  5. NOTE: Upgrading to SAS 9.3, 30-Aug-2011
  6. NOTE: SAS Global Forum 2012 - Update, 24-Apr-2012
  7. NOTE: SAS Global Forum 2012 - Workflow Management, 24-Apr-2012
  8. NOTE: SAS Global Forum 2012 - Futures, 25-Apr-2012
  9. NOTE: Enterprise Guide 5.1 - Now Shipping!, 27-Feb-2012
  10. Testing - Peer Reviews, 13-Dec-2011
The fact that nine out of ten of the posts have a "NOTE:" prefix immediately shows that the posts about SAS syntax and functionality got many more hits than those about software development best practice (I don't use the "NOTE:" prefix for posts that are not specific to SAS software). That disappoints me a little because my aim for the blog is to spread that best practice. However, I enjoy researching and writing the articles, and I can see from the stats that the "best practice" articles do have a decent amount of readership. I could guess that they don't match Google search strings so readily as those with SAS syntax within them.

I hope you had a good Christmas. Here's to a healthy and happy New Year.

Wednesday 19 December 2012

NOTE: Metadata-Bound Libraries in Action

Following my recent post about the excellent new metadata-bound libraries in V9.3 M2, I noticed Paul Homes publish a blog article with the results of his testing of this new capability. Paul shows some code samples and associated log output. Take a look! You can see the error messages that result from invalid attempts to access a table in a metadata-bound library.

My reference here to Paul's article is somewhat recursive given that Paul's article mentions my own original article! Thanks Paul.

Tuesday 18 December 2012

NOTE: Present Thinking

Christmas approaches, I've opened 18 windows in the SAS Professionals advent calendar (without winning anything, yet), written most of my Christmas cards, and my mind is firmly focused on the remaining Christmas shopping. However, I've allowed my mind to wander a little and think about what SAS-related gifts I might like to give or receive.
  • Number one has to be a trip to next year's SAS Global Forum. Not only is it the best opportunity of the year to learn about SAS technology, to meet fellow SAS practitioners, and to meet SAS developers, it's also a great opportunity to visit the great city of San Francisco. I'll be there; will you?
  • Along the same theme, a trip to SAS Professionals Convention in Marlow has to be the best value event of 2013 if the prices of 2012 are retained. Frustratingly, we're still waiting for the dates to be announced.
  • If I'm looking for something a little cheaper than trips to Marlow or San Francisco, there are a few books I'm looking forward to reading. Firstly, The 50 Keys to Learning SAS Stored Processes by Tricia Aanderud and Angela Hall. It was published earlier this year,but I haven't gotten around to getting my own copy yet. Stored processes (as I said yesterday) are an excellent means of packaging your code and making it available anywhere (seemingly). You can never know enough about stored processes
  • Another book I'm looking forward to reading is Chris Hemedinger's Creating Custom Tasks for SAS Enterprise Guide using Microsoft .NET, due to published early next year. I mentioned Chris's book back in October. EG custom tasks are not as widely-accessible as stored processes (limited, as they are, to just EG and Add-In for Microsoft Office) but they nonetheless provide great benefit as a means of packaging your functionality and making it available to you and others in a parameter/wizard-driven fashion.  
  • Books I've already read and would recommend jointly are: Performance Dashboards by Wayne Eckerson, and The Design of Information Dashboards Using SAS by Christopher Simien PH.D. These two publications make an excellent pairing, taking you from the high-level theory of dashboards (as something much more than colourful reports) through to copious SAS examples of dashboarding techniques. Both books rightly highlight the need to design a dashboard as a human interaction mechanism prior to diving into the coding. If you're not familiar with the works of Few and Tufte then you'll struggle for respect as a producer of dashboards. 
  • If £20 is stretching your budget(!), you could do much worse than to look at Phil Holland's App/Books that I mentioned back in September. Available for Android, Chrome, and webOS, the books are delivered as apps to your device and updated with extra pages (and information) for free from time-to-time. Each app/book costs just £1 - £2.
Okay, day-dreaming over, I'd better get my concentration back to my real Christmas shopping list. Will the Bluewater mall be empty of shoppers this evening? Wish me luck! 

Monday 17 December 2012

NOTE: Calling Stored Processes from SAS Code (PROC STP)

Stored Processes. Brilliant. An excellent (and easy) means of packaging your SAS code and making it available in parameter-driven form through Enterprise Guide, Microsoft Office applications (through the SAS Add-In for Microsoft Office), Information Maps & Web Report Studio, the Stored Process Web Application, your own web applications. And PROC STP.

Yes, there's a PROC STP! It's not in the Base SAS 9.3 Procedures Guide, Second Edition, you need to look in the SAS 9.3 Stored Processes: Developer's Guide to discover it. It's worth looking, because the PROC offers a lot of stored process goodness.

Firstly, it's worth noting that PROC STP's LIST statement will show details about a specified stored process, including where the code is stored (don't forget that SAS V9.3 optionally allows stored process code to be stored in metadata instead of as an external file).

However, surely the best use of PROC STP is as a "super-macro". PROC STP allows you to call a stored process from any base SAS code (including another stored process or DI Studio user-written transform). The PROC's INPUTDATA, INPUTFILE, and INPUTPARAM statements allow your inputs to be specified, and their are OUTPUTxxx equivalents too.

It's an excellent addition to a SAS programmer's toolbox. However, I need to offer a couple of word of caution:

PASSWORD. To access the stored process definition, your code must have established a metadata server connection. Thus, in many cases, you will need to code an OPTIONS statement with a number of METAxxx parameters, including METAPASS with an appropriate password.

LOCALITY. The stored process code won't be executed as a stored process. Frankly, I'm not 100% clear on how it executes. It is not within a stored process server, but it is also not executed within the calling code's SAS session. It appears that a new workspace session is created, with its own WORK library, etc, and the stored process code is executed within this new environment. Allied with this is the fact that the stored process code must be directly accessible to your local environment. In practice, this means that the code needs to be in the metadata server or on your local server.

I don't yet have a lot of experience using PROC STP myself, and I haven't found much experience on the web either. I'm looking forward to experimenting more, and to seeing lots of quality papers on the subject at next year's SAS Global Forum.

Monday 10 December 2012

How Do You Read?

[UPDATE: In this article, I recommend the use of Google Reader. Google retired Reader on 1st July 2013. This article still holds value; just substitute Feedly for Google Reader! I now highly recommend Feedly for reading news feeds.]

There's a lot of information out there in internetland; constantly being updated and added to. A lot of it is good, intelligent information, but it's spread across many web sites. Visiting each of those web sites on a regular basis, checking for updates, is time-consuming and frustrating.

Wouldn't it be so much easier if the new and updated information came to you when it was published, rather than you searching for it? But you don't want it sent to your email inbox because you're concerned that your inbox will become full-up. An RSS Feed Reader will solve all of your problems. It's like having your own personal newspaper, full of new and fresh content about things of your own choosing.

You don't need to download and install any software on your desktop if you use a browser-based RSS Feed Reader such as Google Reader. At the end of this article, I've provided a step-by-step guide to get you started.

RSS (Really Simple Syndication) is a way of collecting regularly changing web content from your favourite sites. It enables you to get all the latest information and news summaries in one place, as soon as it is published, without having to visit the individual websites you have taken the feed from.

To receive an RSS feed you will need a Feed Reader. This is a piece of software that automatically checks the feeds from your chosen sites and lets you read any new articles that have been added. And once you've read an article, most Feed Readers will then hide it so that you can easily distinguish between read and un-read articles. A variety of Feed Readers are available for different platforms. Some are accessed through your browser but you can also use a downloadable application.

Feed Readers bring automatically updated information straight to your desktop, tablet or mobile phone. You can monitor news, blogs, job listings, personals, and classifieds. More and more sites offer feeds, which you can identify by a small button that says either RSS (see the logo above) or XML. However, if you click one of these links, you will most likely get a page full of code in your browser. To properly read the feed, you need an RSS Feed Reader; take the URL of the page and paste it into the Subscribe option of your Feed Reader.

I use Google Reader on my desktop (via a browser), tablet and mobile phone. The advantage of a cloud-based reader like Google Reader is that its list of read and un-read articles is synchronised between all of my devices. So, when I'm sat on the train in the morning, I can read my feed via Google Reader on my tablet; if the train is full, I have to stand, and I don't want to hold my tablet, I can use Google Reader on my phone; and if I have some spare time during my lunch break, I can use the browser on my client's desktop computer to read my feed. Google Reader keeps a central record on new articles and read articles. All-in-all, I have my personal newspaper wherever I go, it's always up-to-date, and I never read the same article twice.

Google Reader isn't limited to Android devices and browsers for desktops; you can get suitable readers for Apple's iOS, e.g. MobileRSS and Byline; and you can try Flux and NextGen Reader on Windows Phone.

Over time, I've subscribed to a wide variety of web sites and blogs on a wide variety of topics (SAS, Android devices, motorsport, project management, technology, and my kids' own blogs). Some feeds are keepers, others I unsubscribe after a few days or weeks. Google Reader lets me keep my subscriptions in folders, so I can distinguish between topics.

Before I finish, let me offer one piece of advice. You need discipline in order to occasionally avoid becoming overwhelmed by the number of new articles. Unlike a daily newspaper that's has a predictable number of pages and articles each day, the number of articles appearing in your Feed Reader will vary. On occasion, you will have an overwhelming number to read. Don't be afraid to use the Mark As Read feature to ignore or skip them. Look at it this way.. If you hadn't started using your Feed Reader you probably wouldn't have seen those articles; so if you skip or ignore some articles occasionally, you haven't really lost anything. It takes discipline to "throw away" good information, but sometimes it's necessary.

All-in-all, I'd be lost without my Feed Reader. On each of my devices, I am kept up-to-date with all of the topics in which I hold an interest. And, as you may have noticed, some of those articles make their way into NOTE: from time-to-time.

HOW DO I GET STARTED?...

Oh, so I convinced you? Fab. Here goes...

1. Launch a browser on your desktop, skip over to http://reader.google.com, create yourself a Google account if you don't already have one, and login

2. Subscribe to some content. Let's try a couple of examples...

3. You're first choice will be NOTE:, right?!
3a. Go to http://www.NoteColon.info and look for Subscribe From A Feed in the right-hand margin
3b. Click the Posts button (showing the RSS icon) and then click the Add to Google button
3c. In the resulting screen, click the Add to Google Reader button
3d. It's all done - that was quick and easy. You're now in Google Reader, with the ten(?) most recent articles shown as unread. Read them and scroll down; Google Reader will automatically mark them as read as you scroll past the bottom of each article. In the left margin you'll see the number of unread articles in bold alongside the subscription

4. How about BI Notes blog? It doesn't show an RSS icon...
4a. We like the material at http://www.bi-notes.com/, but there no RSS icon to click
4b. No problem, just copy the URL, go to Google Reader, click Subscribe near the top of the left margin, enter the URL for BI Notes, and click Add
4c. All done. In the left margin of Google reader you now see two items in the list of Subscriptions; the bold numbers tell you how many unread articles you have

5. It's easy to unsubscribe from a feed; just  hover your mouse over the name of the feed in the list of Subscriptions; you'll see a little pull-down arrow appear at the right-hand end of the name of the feed; click on the pull-down arrow and select Unsubscribe from the menu

6. You can now download a Google Reader app on your mobile device(s), login, and see a synchronised list of subscriptions and unread articles. And your mobile app will allow you to add (and remove subscriptions) too

7. Once you've got more than a few feeds, spread across multiple topics, you can add folders to Google Reader and then move your feeds into them. Just hover your mouse over the name of the feed in the list of Subscriptions; you'll see a little pull-down arrow appear at the right-hand end of the name of the feed; click on the pull-down arrow and select New Folder from the menu

Happy reading!

Monday 3 December 2012

End-To-End Debugging with Six Sigma DMAIC

I've mentioned my use of Six Sigma techniques for debugging a couple of times before (5 Whys and Ishikawa diagrams) but a mention of  the Six Sigma approach to end-to-end problem resolution (and process improvement) is long-overdue.

Known as DMAIC (pronounced Duh-May-Ick), it's an abbreviation for Define, Measure, Analyse, Improve, and Control. Used in combination, the five steps in the DMAIC process can be used to identify and resolve your most complex issues. As part of the Six Sigma approach, DMAIC can be used to improve existing programs and applications (pro-actively fixing them before they break!).

The five steps lead a team logically through the process by defining the problem clearly, implementing solutions linked to root causes, and taking steps to ensure the solutions remain in place. You can try skipping some of the steps, but in my experience they each contribute a valuable part of the lasting solution. The basics of each step are:

DEFINE - First of all, make sure you have a clear and precise definition of the issue. This might include a list of symptoms, plus some information about the negative impact on users and/or the system. Make sure you understand priorities and objectives. All-in-all, this is an exercise in pulling together what the team already knows, and making sure that each member of the team is heading off to solve the same issue

MEASURE - Use the measurement phase to gather additional information about the issue and the impact of the issue. The aim is to gather as much information as is practical, for the purpose of exposing the root cause or causes of the issue. It may be appropriate to capture temporary/intermediate files or network traffic, or to look for patterns in the surrounding activity in the system. Remember that this is a data capture phase, you're not trying to solve the issue at this point

ANALYSE - In the analysis phase, we want to pinpoint and verify root causes in line with our priorities and objectives. Always be prepared to distrust the evidence or the means by which it was collected. Be careful to avoid "analysis paralysis", i.e. wasting time by reviewing data that isn't moving the investigation forward. Remember that the aim is to identify the root cause (or causes), not to define one or more solutions

IMPROVE - This phase identifies solutions, prioritises and selects them. It may be appropriate to implement a pilot of one or two solutions prior to finalising your decision and implementing the definitive solution. Your choice of solution may be influenced by impact analysis that shows the full knock-on effect of implementing each potential solution. Be sure to gain proper confirmation of success from appropriate stakeholders before implementing the definitive solution

CONTROL - Often overlooked, the control phase is post implementation of the fix or improvement. Use the control phase to make sure that lessons were learned and that the problem doesn't re-occur (nor problems of a similar nature). Add additional test steps to your regression testing suite and put additional control & validation steps in your application. If it's not practical to stop all potential re-occurrences  give thought to how the issue could have picked-up sooner and dealt with more quickly

The five steps seem like common sense, but in the heat of a high priority, complex issue it is easy to forget the some of these basics. I find it helps me a great deal to have the five steps at the back of my mind as my team and I investigate issues. I mentally tick-off each phase and makes sure that we've got all the information we need to proceed to the next step.

I hope you don't get any complex issues, but if you do (we all do, right?) then you will find DMAIC to be a useful guide.

Saturday 1 December 2012

NOTE: SAS Professionals Advent Calendar

It's December 1st, and that means it's time to hop over to the SAS Professionals web site to begin the daily pleasure of opening the advent calendar to bring some Christmas cheer - and possibly winning a gift.

And if you're not already a member, I recommend that you sign-up and check-out the Expert Channel's videos and the forums, and benefit from the ability to network with fellow SAS practitioners online!

And, don't forget to attend next year's SAS Professionals Convention in Marlow to grab more networking opportunities and to learn from papers delivered by a mixture of SAS staff and customers.

Our digital radios are tuned to Smooth Radio Christmas, and we'll be heading out to get our Christmas tree this weekend. I offer an early "merry Christmas" wish!

Wednesday 28 November 2012

NOTE: Metadata-Bound Libraries

Since the introduction of metadata-defined LIBNAMEs in the earliest days of version 9, it's been a frustration that the security that can be applied within SAS metadata to control who can access libraries can be completely undermined by users simply hand-coding an equivalent LIBNAME statement with a specific path to the data and thereby bypassing the SAS metadata security layer. It seems that V9.3 M2 introduced a solution to this, but it competely slipped under my radar - until now (my thanks to BS for alerting me to this).

The new SAS 9.3 Guide to Metadata-Bound Libraries tells us how data sets and views within metadata-bound libraries can only be accessed via the metadata-defined LIBNAME. The data sets are created with a special flag in their internal metadata which specifies their nature. Thus, access from SAS to data within a metadata-bound library is provided only if all of the following conditions are met:
  • The requesting user can connect to the metadata server in which the corresponding object is stored
  • The requesting user’s metadata identity has all required metadata-layer effective permissions for the requested action
  • The host identity with which the data is retrieved has all required host-layer access to the data.
In my view, this is a very significnt enhancement to the security of SAS data. SAS metadata has long provided powerful and flexible capabilities for protecting your data, but it has always been possible to completely bypass it and leave the OS-level security as the gatekeeper. Applying passwords to data has never been a great solution because of the weak encryption and the need to hard-code the passwords in SAS code.

The security provided by metadata-bound libraries is strong, even surviving when the physical table is recreated or replaced. The cornerstone of this approach is the fact that the physical table contains the flag to specify it's a metadata-bound table, so all elements of SAS are available to respect the need to check the access permissions via metadata.

Inevitably, it's not a panacea. For instance, you can only bind BASE SAS data sets and views, and you cannot bind concatenated libraries; and though the binding prevents unauthorised access from SAS, it does not prevent non-SAS access to the data (non-SAS access is limited only by the OS-level security), so it is still possible to delete or rename tables without authorisation via SAS metadata.

All of this is made possible by the new PROC AUTHLIB (there's no GUI interface for creating metadata-bound libraries yet). AUTHLIB's CREATE statement allows you to create the binding.

This is a hugely significant step forward for SAS security, and a major benefit to be derived for anybody considering an upgrade from any version of SAS prior to V9.3 M". And do note: It's the second maintenance release of V9.3; metadata-bound libraries are not available in earleir versions of V9.3.

NOTE: ODBC Performance

SAS is great at getting data from a huge variety of sources. With its SAS/ACCESS connectors, SAS can get data from these sources in an optimised fashion, i.e. using the native capabilities of the source data provider. In these days of increasingly large set of data, optimisation and efficiency are crucial factors. Steve Overton wrote an article in the Business Intelligence Notes blog earleir this month in which he offered some experience and advice with regard to gatrhering data into SAS via ODBC.

ODBC is a generic means of accessing a large variety of different data sources. As such, it's less easy to optimise the process, but nonetheless we want the data to flow at the best possible rate. In SAS Administration: Fetch Big Data Faster Across ODBC, Steve describes how judicious use of the FETCH and USEDECLAREFETCH parameters in the ODBC.INI file can make big differences to the speed of your data access. Valuable.

Monday 26 November 2012

NOTE: Documenting Your SAS Environment

If you're a new starter, or somebody just gave you extra SAS administration responsibilities, you may be struggling to find your way around the new SAS environment. Brian Varney presented an insightful paper at this year's South East SAS Users Group (SESUG) entitled Getting to Know an Undocumented SAS Environment. Brian's insights will be of use to those pitched into the situations I described above.

Brian structured his paper into what, where, and who. In each section, Brian presented brief tips and techniques for discovering details about the SAS environment.

How do I know Brian presented this paper? Did I visit Durham in North Carolina and attend SESUG? Sadly, no. But I do subscribe to SAS's SAS Users Groups blog. It reduces the jet lag! Christina Harvey's How to Document Your SAS Environment article alerted me to Brian's paper. If you're in need of a better understanding of your SAS environment, I recommend you check it out.

AND, it's clearly a popular topic because David Chapman was talking on the same topic at NESUG (NorthEast SAS Users Group). In Determining What SAS Version and Components Are Available (MA01) (highlighted on the SAS Users Blog, again), David discussed a macro that he had written to display salient information. I was most interested to follow his reference to SAS Knowledge Base article KB20390 which offers some very neat code (with very neat output, more to the point) for displaying what server software you're licensed for, what you have installed, version numbers and a bunch of other stuff.

NOTE: Getting Social With SAS Metadata

I noticed a most intriguing post on Paul Homes's Platform Admin blog recently. Do you and your colleagues discuss your metadata often? Paul thinks you should, and I'm inclined to agree.

This isn't a new or unique idea. SAS were talking about a collaboration framework at this year's SAS Global Forum, and I wrote a brief post about it. The idea of having a platform to facilitate business-like discussions that are focused upon specific business objects such as web reports, information maps, tables, stored processes and cubes seems to hold value.

You'll recall that Paul runs Metacoda Pty Ltd, providers of SAS services plus the excellent Metacoda Security Plug-Ins for viewing your SAS security metadata and rules. Well, Metacoda are now in the final stages of development of a new product to facilitate discovery and discussion of your metadata.

Fundamentally, the Metacoda product (which doesn't seem to have a name yet) will provide:
  • Activity: get notified about any changes and discussions on items of interest to you
  • Search: find the items you want and register your interest in seeing activity for them
  • Discussions: share your knowledge and learn from the knowledge and experience of others
  • Easy Access: get easy access from anywhere: browsers on desktop PC’s, tablets, or smart phones, and even custom applications, add-ons, and plug-ins
  • Performance: to make it as fast as we can, so you can find what you need, when you want it, and don’t miss out on shared knowledge because it takes too long or it’s too hard to find
  • Security: only provide access to metadata you normally have access to
I think the idea has great merit. Metadata is not just a technical thing; it represents the objects that are important to our business. Paul is seeking collaboration with enterprises who might be able to make immediate use of Metacoda's new tool. If your interest is piqued, get in touch with Paul via the link at the bottom of his post.

Wednesday 21 November 2012

NOTE: Now I see Visual Analytics

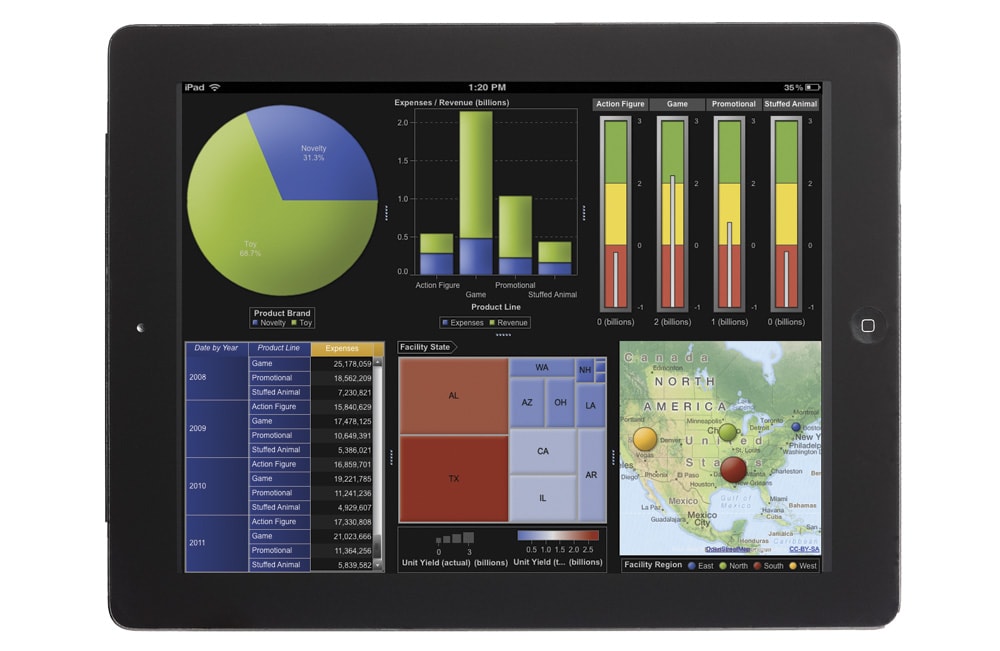
I'll confess that whilst there was a lot said about SAS Visual Analytics at this year's SAS Global Forum, I came home with some confusion over its architecture, functionality and benefits. I was fortunate to spend some quality time with the software recently and I think I've now got a good handle on it. And it's impressive.

It's comparatively early days in its life cycle; it provides value for a significant set of customers, but it will benefit an ever larger population as it evolves and gets enhanced over time.

The key benefits as I see them are i) its handling of "big data", ii) its user friendly yet highly functional user interface, and iii) its ability to design a report once yet deliver the report through a variety of channels (including desktop, web and mobile).

The big data element is delivered through in-memory techniques that are incorporated in the SAS LASR Analytic Server. In essence, this means that you need to reserve a number of servers (on commodity "blade" hardware or on database appliances from EMC Greenplum and Teradata) for the purpose of providing the in-memory capabilities. Once the data is loaded onto the LASR server and copied into memory, users can explore all data, execute analytic correlations on billions of rows of data in just minutes or seconds, and visually present results. This helps quickly identify patterns, trends and relationships in data that were not evident before. There's no need to analyse sub-sets of your data and hope that they are representative of the full set of data.

The user-friendly interface is largely drag-and-drop in a similar style to the design of Excel pivot tables. There is a wide range of output styles such as tables, graphs, & charts, and these can be laid-out into a report and linked together for synchronised filtering, drilling, slicing and dicing. The current release incorporates regression analysis and correlations. I anticipate that future releases will soon after more functionality such as forecasting.

The reports that you design in Visual Analytics are simultaneously available through a number of channels including web, and  mobile on iPad & Android. This means that your dashboards and reports are available to anybody, anywhere (combined with SAS security measures that make sure nobody sees any information that they are not meant to).

All-in-all, SAS Visual Analytics is another step in taking away the friction caused by technology limitations and allowing analysts to execute their analytical processes more effectively and efficiently. Less programming, more analysis, better results.

Monday 19 November 2012

NOTE: Clean Your Cubes

It's not spring-time, but it's still worth giving a thought to the cleanliness of your environment, for the benefit of reducing complexity and of reducing space usage. Angela Hall posted a great article about Cleaner OLAP Cube Physical Folder Structures earlier this month on SAS's Real BI for Real Users blog.

In her article, Angela gave a "below the water line" view of OLAP cubes and how they are maintained and stored. Her tips for cube rationalisation will reduce disk space usage and improve performance. Well worth a look.

Coding For All - Competition for the Family

There's a debate in the UK, and many other countries around the globe, regarding the content of the IT curriculum (or, ICT as it's known in the UK). Speaking from experience, my kids have been taught how to use Microsoft Office products, but they haven't been taught programming in any of its guises. I've bemoaned this in the past, and I continue to do so.

There is an increasing number of fun ways to learn programming and computer science. The Raspberry Pi device is one good example. Another, not mentioned in these pages before, is the App Inventor for Android. You don't need an Android phone to use this Google-initiated tool to develop real-life apps for Android phones. I showed this to my daughter and she was instantly inspired to create a One Direction soundboard app and share it with her Android-toting friends. Result!

As I say, you don't need an Android device to use App Inventor. That's because it has a built-in phone emulator that you can run on your PC. The emulator is a precise emulation of an Android phone, so you have to wait for Android to load on the phone and then swipe horizontally to unlock it.

The concept of App Inventor is to permit the creation of programs by visual means - designing the screen, then creating the program by slotting together a wide variety of jigsaw-like programming constructs. It sounds limited but it's not.

App Inventor started life as a Google experimental lab project in 2010 but it was halted at the end of 2011. Massachusetts Institute of Technology (MIT) took over the support of the project and it's now known as MIT App Inventor. It has a few rough edges, but it's worth persevering through those small problems because the ability for kids to create mobile phone apps is inspirational. Not only is my daughter hooked but those to whom I've recommended it now have their own kids hooked on producing increasingly complex and functional apps too.

And what better way to promote something than with a competition. That's just what MIT have done. With four different age categories (including an open age category for adults), and a first prize of a Nexus 7 Android tablet in each category, there are many good reasons to get the app of your kids chosen as "most outstanding". The competition closes December 12th so you have a good number of weeks in which you or your kids can i) think of a great app idea, and ii) get familiar with App Inventor and get coding.

To get started with App Inventor, go to the site, click Explore, go to the Learn tab and follow the tutorials. In the Setup tutorial, make sure you install the App Inventor software on your PC. However, to enter the competition you'll need to join the App Inventor Community Gallery (The Gallery is in Beta, go to The Gallery to request full access).

There is some excellent learning material on the App Inventor web site, but you can also find a lot of fabulous information at Professor David Wolber's site. Prof Wolber teaches computer science at the University of San Francisco (spooky, San Francisco again!) and uses App Inventor in his courses - and he wrote the App Inventor - Create Your Own Android Apps book.

Enjoy yourself. Good luck!

Wednesday 14 November 2012

NOTE: Comment-Driven Design

I started the NOTE: blog in 2009. It was a successor to the highly-popular email newsletter that I used to send between 2001 and 2006. At its height, the email newsletter had 4,000+ subscribers. One of the regular features was "SAS With Style". Below, I've included one from 2001 which still holds true and which I still practice today.

The focus of the tip is comments. Despite attempting to write unit specifications that provide sufficient detail of what is to be built and coded, I occasionally find that I have provided insufficient detail in some places (yes, I know, you're shocked!). In some cases it will be appropriate to revisit the documentation to augment it, but in others it may be pragmatic to include the detailed design in the code. Moreover, for those to whom external documentation is anathema, it is crucial that the comments in the code reveal the full rationale and intention of the design.

Jef Raskin wrote a good essay on the subject back in 2005. You can still find it on the Association for Computing Machinery (ACM) web site. It's entitled Comments are More Important than Code. Ed Gibbs added some of his own thoughts to the discussion in 2007 in his Musings of a Software Development Manager blog. Ralf Holly provides a neat, alternative summary of the topic in his 2010 blog entry. All three articles are worth a read.

My own tip from 2001 was more basic, but falls into the general approach discussed by Jef, Ed and Ralf. Here it is:
One of the less-attractive aspects of a programmer's life is maintaining existing code. Most programmers would prefer to be creating something new rather than manipulating old code. But maintaining old code is a necessity, be it your own code, or somebody else's. And in those circumstances, you will be grateful if the code has been written in a neat and clear fashion.

Comments are a critical part of your programs, and they can be used in many different ways. I like to encourage the use of "overview" blocks at the top of large sections (a whole program counts as a "large section"). The individual lines of the overview then get used to head-up the respective sections of code. The code might look like this:

/******************************************************/
/* 1. Get subset of the demog info                    */
/* 2. Get subset of the lab info                      */
/* 3. Get subset of the meds info                     */
/* 4. Merge demog, lab, and meds and transpose result */
/* 5. Create final transport file                     */
/******************************************************/

/***********************************/
/* 1. Get subset of the demog info */
/***********************************/
code to do the demog subseting

/***********************************/
/* 2. Get subset of the lab info   */
/***********************************/
code to do the lab subseting

/***********************************/
/* 3. Get subset of the meds info  */
/***********************************/
code to do the meds subseting

/******************************************************/
/* 4. Merge demog, lab, and meds and transpose result */
/******************************************************/
code to do the merge and transpose

/***********************************/
/* 5. Create final transport file  */
/***********************************/
code to do the proc cport

The overview block gives any maintenance programmer a great outline of the program and also acts as some kind of index. A general rule of thumb is to have between 6 and 12 sections (yes, I know the example breaks the rules). If the code in any of the sections is large, consider using a secondary level overview block to break it down further.

This style of commenting simply follows the oft-quoted rule of divide and conquer - break down your problem into small, manageable pieces and solve each of them in turn.
Putting aside my mis-spelling of "subsetting" (albeit, I was very consistent!), this eleven year old tip is still an approach that I frequently follow today.

Tuesday 13 November 2012

NOTE: The Expert Channel at SAS Professionals

Next year's SAS Professionals Convention will be in Marlow, 10 - 12 July. If you're in the UK, or able to travel to the UK, it's one of the most valuable training events you can attend in 2013. And very reasonably priced too (£150 for three days in 2012). However, the SAS Professionals web site offers a lot of valuable information year-round, including the Expert Channel. The Expert Channel offers expertise direct to you on-demand and via interactive live sessions.

If you're not already a member of SAS Professionals, get yourself over to the web site and sign yourself up (for free) immediately! Members should take themselves to the Expert Channel group page and make sure they have joined (for free). And once you're in the group, click on the large blue "To Access the Expert Channel On Demand Click Here" graphic and get yourself to the Expert Channel Navigator page.

From the Navigator page, there are videos aplenty to view and learn from. One of the most popular series is SAS In 60 Seconds. This series is sub-divided into Base SAS, SAS Enterprise Guide, and SAS Web Report Studio. In each sub-division there are plenty of short (60 second) videos on key topics. The bite-size videos are a great way to pick-up new information.

Much of the other On Demand material on offer is derived from the live web sessions that are offered on a monthly basis. These recordings are usually closer to an hour in length. There's a large set of recordings in the  SAS Certification Tutorials sub-section. If you're planning to sit for any of the SAS certifications in 2013, you should check these out.

Depending on your circumstances (and your time zone), the live sessions might be more difficult to access. But it's good to know that the sessions are recorded and made available on demand. Yesterday's session was "SAS Certified Advanced Programmer for SAS 9 Tutorial", next Monday's will be "SAS Certified Base Programmer for SAS9 Tutorial", and this will be followed by "SAS BI Content Development for SAS 9 Tutorial" on Monday 26th November. Events continue into December with topics including Data Integration and Platform Administration. You can see the full programme in the Events section. If you plan to attend any events, be sure to register (it's free).

So, all-in-all there is a wide variety of quality material available. It's worth taking the time to get through the multiple steps required to join SAS Professionals and then join the Expert Channel group. And don't forget to make sure you've budgeted for SAS Professionals Convention 2013!

Monday 12 November 2012

NOTE: More on Ishikawa

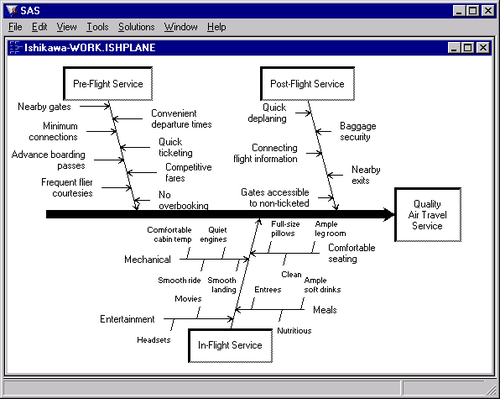
I recently mentioned the use of Ishikawa diagrams for assistance with problem solving. I have frequently found them to be of value. However, what I had never realised, until my friend Chris Brooks pointed it out, is that there's a PROC ISHIKAWA in SAS! It's part of SAS/QC (for Quality Control of processes), so that's my excuse; I've never used any PROCs from QC.

I recommend the creation of Ishikawa diagrams on paper (as part of a team process, using a white board or something similar). However, it can be useful to create an electronic copy after the event, and PROC ISHIKAWA may be the ideal tool for that purpose if you're licensed for SAS/QC.

PROC ISHIKAWA provides an interactive environment in which you can:

  • add and delete arrows with a mouse. You can also swap, copy, and so forth
  • highlight special problems or critical paths with line styles and colour 
  • display additional data for each of the arrows in a popup notepad 
  • display portions of the diagram in separate windows for increasing or isolating detail. You can also divide sections of the diagram into separate Ishikawa diagrams
  • merge multiple Ishikawa diagrams into a single, master diagram 
  • display any number of arrows and up to ten levels of detail 
  • foliate and defoliate diagrams dynamically 
  • save diagrams for future editing 
  • save diagrams in graphics catalogs or export them to host clipboards or graphics files 
  • customise graphical features such as fonts, arrow types, and box styles
Who knew?!

Thanks for the tip, Chris. Recognition at last ;)

Saturday 10 November 2012

Now That's What I Call Data Visualisation!

This video from the McLaren Formula 1 team is artistic as well as informative. The film merges photography, animation and sculpture and is a truly unique way of representing aerodynamics.

The car in question is the McLaren P1 supercar from McLaren Automotive.

Will this technique be available in SAS? Version 10 in 2014?! [just kidding]

Tuesday 6 November 2012

NOTE: SGF 2013 Obsession #sasgf13

I think I'm becoming a bit obsessive about SAS Global Forum 2013, to be hosted by San Francisco. I mentioned a couple of months back how the sound of The Flower Pot Men had been floating around my head - Let's Go To San Francisco. I realised last night that I've been watching a lot of San Francisco based movies recently. Is this healthy?!

It started when we got a trial Netflix subscription and I watched Clint Eastwood in Escape from Alcatraz (on our TV via my son's Xbox). I'm not a great movie watcher, but I did enjoy the film and it inspired me to try-out some movies from the Google Play store and watch them on my Android tablet. It was a positive experience. It was easy to rent the movies, and the playback on the tablet was good. And, I noticed that I can stream them or I can download them. With 30 days in which to watch them, I noted the fact that I could download a number of movies onto my tablet and watch them during my journey to/from SAS Global Forum.

What movies have I watched on my tablet? Well I continued the action theme by watching Steve McQueen in Bullitt, then I returned to Clint Eastwood in Dirty Harry, and then I saw The Maltese Falcon. None of them new, but all classics. It was while I was watching The Maltese Falcon that I realised that all four films were set in San Francisco. I hadn't deliberately set out to watch San Franciscan films.

My favourite? It has to be Bullitt. I'm a petrol head and I loved McQueen's Mustang. Just the sound of the engine was heavenly.

Is all this interest in San Francisco healthy? I'm not sure, but I've enjoyed the films, and I'm looking forward to learning lots at SAS Global Forum next year, so it can't be all bad.

Monday 5 November 2012

Debugging With Six Sigma Ishikawa

Back in September 2009 (that seems so long ago!) I wrote an article on problem solving using the 5 Whys technique. Some correspondents suggested that 5 Whys was a trivial/obvious technique, but they were missing the point somewhat - sometimes we overlook the obvious and need reminding of it, and sometimes the simplest techniques can provide the most valuable results.

That said, no one technique is guaranteed to work in all circumstances, so I thought I'd offer another technique that I use quite frequently: Ishikawa Diagrams, another part of the Six Sigma tool kit. They're sometimes known as cause-and-effect diagrams or herringbone diagrams. Again, they appear simplistic; and once again, I say beware of dismissing the simple and obvious! As with 5 Whys, the interaction between the people using the technique is perhaps the heart of the process, but the process guides and facilitates the discussion and discovery of information. Like 5 Whys, Ishikawa diagrams will help you to get to the root cause of your issue.

To use an Ishikawa diagram:

A) Determine a clear, brief description of the issue. Write it at the head of the fish bone skeleton, on the end of the spine

B) Decide the major categories for causes and create the ribs of the skeleton, writing one category at the end of each rib bone. These vary depending upon the industry and the situation in which the Ishikawa diagram will be used. I generally use a variation of the 6 Ms (used in manufacturing industries):


MDescriptionRecommendation for SAS
MachineEquipment / TechnologyHardware or software
Method ProcessProcess
Material Includes Raw Material, Consumables and InformationData
Man Power Physical work / Mind Power (brain work)People
Measurement InspectionInspection
Mother Nature EnvironmentEnvironment (physical or logical)

C) Now challenge the assembled group to contribute possible causes under each of the major categories. There are many ways to do this, such as by brainstorming or by asking each person to contribute one suggestion for each major category. Place each suggestion alongside the associated rib. As with mind-mapping, you might want to divide and sub-divide your suggestions. Remember, at this stage we're looking for potential causes, not solutions

D) Now review the diagram. Remove any suggestions which clearly don't apply to the specific issue at-hand, and try to garner further suggestions for categories where there are fewer suggestions. To drive down to the root cause, it may be appropriate to adopt a 5 Why approach for each suggestion

E) Discuss the diagram and agree the causes that you all think are the most likely to be at the root of the issue. It's okay to rely on experience and instincts at this point

F) Finally, develop plans to confirm that the potential causes are the actual cause. It is important to concentrate on proving the root cause before taking action to resolve the issue

Ishikawa diagrams are a great way to engage all participants and get a balanced list of ideas. They provide structure for any review session, and they encourage participants to push beyond symptoms to uncover potential root causes. However, you'll get the best results if you have a precise problem definition at the start of the review session.

If you look carefully, you can find tools for drawing nice, neat Ishikawa diagrams but, in my opinion, you can't beat getting a group of people armed with marker pens and sat around a whiteboard or drawing board. The human interaction is an important part of the process.

First documented by Kaoru Ishikawa in the late 1960s, Ishikawa diagrams are a firm part of many sets of practices including Six Sigma and ITIL. Highly recommended.

Thursday 1 November 2012

NOTE: SAS Mobile BI on Android

I see that SAS Mobile BI is now available for download from the Google Play store for Android-loving folk like myself. This is in addition to its earlier Apple incarnation. It's good to see SAS keeping to its promise of supporting multiple platforms.

It only appeared yesterday, so there's not been many downloads yet, but I'll follow its popularity with interest. It's a shame I don't have a SAS server I could test it from.

Tuesday 30 October 2012

NOTE: Seasonal Cycles and Date Increments (once more unto the breach)

I've posted a couple of articles recently about the INTNX and INTCK functions for dealing with date/time/datetime manipulation. Whilst researching these I stumbled across some related functions that I'd not heard of before. These functions manipulate date/time/datetime values around seasonal cycles (i.e. days within weeks, months within years, etc.) and provide other useful facilities.

Seasonal Cycles

INTSEASReturns the length of the seasonal cycle when a date, time, or datetime interval is specified.
INTCINDEXReturns the cycle index when a date, time, or datetime interval and value are specified.
INTCYCLEReturns the date, time, or datetime interval at the next higher seasonal cycle when a date, time, or datetime interval is specified.
INTINDEXReturns the seasonal index when a date, time, or datetime interval and value are specified.

Other Useful Date Functions

INTFITReturns a time interval that is aligned between two dates.
INTFMTReturns a recommended SAS format when a date, time, or datetime interval is specified.
INTGETReturns a time interval based on three date or datetime values.
INTSHIFTReturns the shift interval that corresponds to the base interval.
INTTESTReturns 1 if a time interval is valid, and returns 0 if a time interval is invalid.

They're the kind of functions that are life-savers to some, and of little or no interest to others. If you're in the former category and you've not heard of them before, then I'm glad to have been of service!...

Monday 29 October 2012

NOTE: More on Date Increments (INTCK and INTNX)

It's always encouraging to get feedback about my blog articles and/or see an article spark some conversation. Last week's Date Increments (INTNX and INTCK) featured the INTNX function for incrementing (or decrementing) date, time, and datetime values by specific intervals such as HOUR and MONTH. I highlighted the optional fourth parameter that can be used to specify where in the interval the result should lie. The article created a small flurry of tweets from @DavidKBooth and @LaurieFleming, including:

@DavidKBooth:
@LaurieFleming @aratcliffeuk just discovered intck('year', birthday, date, 'C') which correctly calculates age in years!

@DavidKBooth:
@LaurieFleming @aratcliffeuk it assumes people born on 29feb celebrate birthdays on 28feb in non leap years.

@LaurieFleming:
@DavidKBooth @aratcliffeuk Excellent. That's much so better than floor((intck('month', &birth, &date) - (day(&date) < day(&birth))) / 12)

@DavidKBooth:
@LaurieFleming @aratcliffeuk 4th parameter added in 9.2 - would have been cross if I'd been overlooking it for ages.
 
To be perfectly honest, I've used INTNX a tremendous amount, but strangely I've never used INTCK half as much. I hadn't even realised that INTCK's fourth parameter took different values to INTNX. The valid values are DISCRETE (default) and CONTINUOUS. DISCRETE counts the number of interval boundaries between the two dates; CONTINUOUS counts the number of intervals, starting from the start date, thus it is well suited to calculating (as Dave says) ages. So, today was another learning day for me!


Saturday 27 October 2012

Supporting the 2012 Poppy Appeal

You may have noticed that our twitter avatar has started to sport a poppy this week. This is in support of the Royal British Legion's 2012 poppy appeal - commemorating those who have lost their lives in defence of their country, and providing financial, social and emotional support to those who have served in the Armed Forces, and their dependants. 

We added the poppy (temporarily) using Twibbon. It's a great way to show your support, and optionally make a donation.

You can even donate via your mobile. Just text the word POPPY to 70800 to make a donation to The Royal British Legion. Texts cost £10 plus standard network charges (£9.92 goes to the Poppy Appeal).

Twitter, Fixed

I'd noticed for a few weeks that the Twitter widget in the right-hand margin on the blog wasn't working - it was showing a link to my Twitter page, but no tweets.

Having just done some research, it seems this was down to some change at the Twitter end and many people were suffering the same issues.

I've now replaced the Twitter widget that I'd got from Blogger with a widget that I've just got from Twitter and all now seems to be fine. Please let me know if you continue to see problems.

Frustrating!

Wednesday 24 October 2012

NOTE: Date Increments (INTNX and INTCK)

If you're an experienced SAS practitioner you'll be familiar with the INTNX (and INTCK) function. INTNX takes date, time, and datetime values and increments (or decrements) them by a specified interval, e.g. hours, weeks or quarters. If you're not familiar with the function, I'll give a quick introduction; if you've been using INTNX for years, I'll highlight the SAMEDAY alignment option introduced in SAS V9. V9 was introduced some time ago, but if you were already familiar with INTNX then you may have over-looked the new SAMEDAY option.

By way of a basic introduction, let's assume we have a variable named START that contains a date value, and we want to add three months to it. If we knew the number of days in three months we could do a simple mathematical addition, but the number of days in any three month period can vary. However, help is at hand with INTNX. The following illustrates the solution.

data demo;
  format start end date11.;
  start = '1jun2012'd;
  end = INTNX('MONTH',start,3);
  put start= end=
run;

START=01-JUN-2012 END=01-SEP-2012

As you can see, the date has been incremented by three months. The first parameter of the INTNX function specifies the type of interval, and the third specifies how many intervals (negative values are permissible and result in the value being decremented). The SAS 9.3 Functions and CALL Routines: Reference lists the valid values for the interval; there are many.

There is one feature you need to be aware of. The value will be incremented (or decremented) to align with the beginning of the interval, so INTNX('MONTH', '10jun2012'd, 3) would also result in '1sep2012'd, not the 10th.

There's a fourth parameter of the INTNX function that allows you to specify the alignment as BEGINNING (the default), MIDDLE, and END.

So far, so good, but (perhaps unknown to experienced SAS programmers) V9 introduced a fourth alignment value: SAME.

Armed with this knowledge, we can increment 10th June and get a result of 10th September: INTNX('MONTH', '10jun2012'd, 3, 'SAME').

And finally, INTNX has two optional adjuncts to the interval. Firstly, the interval can be suffixed with a number to indicate larger intervals, e.g. MONTH2 indicates that intervals that are two months in length should be used. Secondly, another numeric value can follow a dot and indicates an offset starting point, e.g. YEAR.3 specifies yearly periods shifted to start on the first of March of each year, and YEAR2.6 indicates that the intervals are each two years in length and that they start on the sixth month. There's more detail on these optional parameters in the aforementioned SAS 9.3 Functions and CALL Routines: Reference manual

Anf finally, finally, I mentioned INTCK earlier. The INTCK function calculates the number of intervals between two specified date, time or datetime values. It uses the same intervals and general style of syntax as INTNX. If you use dates, times, or datetimes, then you need to be good friends with INTNX and INTCK!

Tuesday 23 October 2012

Technical Debt

Last week I mentioned a term that was new to me (Mutation Testing) and so I thought I'd mention another recently acquired term - Technical Debt. In this case I was familiar with the concept, but I hadn't heard the term before. I think the term very succinctly describes the concept.

We're all familiar with the fact that the software that we build isn't perfect. I don't mean it's full of bugs, I mean that there are things we could have done in a more robust or long-lasting manner if we'd had the time or the money. It could be code or it could be architecture. This is our technical debt - things that are an effective and appropriate tactical and short-term choice but which we should put right in the longer-term in order to avoid specific risks or increasing costs (the interest on the debt).

Examples of technical debt include:
  • Incomplete error trapping, e.g. we know that the code will bomb in certain circumstances and will not offer the user any message to explain why it bombed and what they need to do to avoid it, e.g. the supplied data was of the wrong format. As a tactic to get the code out of the door, this is sometimes necessary
  • Hard-coding a series of values rather than placing them in a control file and giving the appropriate people the ability to edit the control file. Again, as a tactic to get the code out of the door, this is sometimes necessary
  • Coding-up a routine that is known to be part of the base software in the next version of the base software. This may be necessary as a short-term measure because the upgrade to the next version of the base software is a significant project in itself
  • Attaching a barely sufficient amount of temporary storage 
  • Using a non-strategic means of getting source data into your ETL process
  • Delivering an early release of software that doesn't fully meet all requirements
Whatever form your own technical debt takes, it is important that you maintain a register of it and that you manage it.

As in our personal lives,debt is not necessarily a bad thing. It allows us to buy a house and/or a car that would otherwise be our of reach. The key thing is to recognise that one has the debt and to manage it - which is not necessarily the same thing is removing the debt.

Release cycles can make a considerable difference in the rate of acquisition and disposal of technical debt. Releasing early and often makes it much easier to take on technical debt but also makes it easier to resolve that debt. When well-managed, this can be a blessing - taking on debt earlier allows you to release more functionality earlier, allowing immediate feedback from customers, resulting in a product that is more responsive to user needs. If that debt is not paid off promptly, however, it also compounds more quickly, and the system can bog down at a truly frightening rate.

Shortcuts that save money or speed up progress today at the risk of potentially costing money or slowing down progress in the (usually unclear) future are technical debt. It is inevitable, and can even be a good thing as long as it is managed properly, but this can be tricky: technical debt comes from a multitude of causes, often has difficult-to-predict effects, and usually involves a gamble about what will happen in the future. Much of managing technical debt is the same as risk management, and similar techniques can be applied. If technical debt isn't managed, then it will tend to build up over time, possibly until a crisis results.

The term "technical debt" was coined by Ward Cunningham in his 1992 OOPSLA paper The WyCash Portfolio Management System.

Technical debt can be viewed in many ways and can be caused by all levels of an organization. It can be managed properly only with assistance and understanding at all levels. Of particular importance is helping non-technical parties understand the costs that can arise from mismanaging that debt.

Aside from reading Ward's 1992 paper, you can find plenty more valuable sources of information on this topic. Here are just a few that I recommend:


Take good care of your debt and it will take good care of you. The reverse also holds!

Monday 22 October 2012

NOTE: Always Striving to Learn More

Aren't SAS users groups and conferences great? We all strive to continue learning, and we can do that a piece at a time through subscription to blogs and newsletters, and we can get great gulps of new knowledge from attending SAS users groups and conferences. If you don't have a convenient local users group (or your employer refuses to let you attend) then you have my sympathy, but all is not lost. The SAS Users Groups blog is run by a great team from SAS and provides highlights from users groups meetings in US.

This month was the turn of the South East SAS User Group (SESUG). Judging by the highlights presented in the SAS Users Groups blog it was clearly a good conference. Two blog articles (linking to conference papers) particularly caught my eye:

Why Use Hadoop?

Macro Headaches. Learn How to Prevent Them

And the Best Contributed papers at Mid West SAS Users Group (MWSUG) offers plenty of quality reading too.

So, even if you don't go to any of the conferences, you have plenty of opportunity to benefit from the presented material. What would you like to know more about?...

Wednesday 17 October 2012

Mutation Testing

I've published a number of articles on testing in the past, and I thought I had a decent awareness and knowledge of the subject. But, as they say, every day is a learning day and I came across a new testing technique recently: Mutation Testing.

I've not yet tried this technique myself, but it certainly seems to offer benefits, and it's a useful extra consideration when you're creating your testing strategy for your project. Mutation Testing forms a test of your tests and so it is not of value in all cases.

In a nutshell, mutation testing involves creating multiple copies of your code, introducing small changes into each copy - with the deliberate intention of breaking the code in some small way - and then running your tests. If your suite of tests is of sufficient quality then each mutant copy of your code will fail at least one of your tests. If not then you need to enhance your tests so that all mutants fail at least one test.

The types of mutations can vary but they typically include 1) negation of logic operators, 2) setting values to zero, 3) use of wrong variable names. The general nature of the mutations is to emulate common programming errors.

Wikipedia tells us that "Mutation testing was originally proposed by Richard Lipton as a student in 1971,[2] and first developed and published by DeMillo, Lipton and Sayward. The first implementation of a mutation testing tool was by Timothy Budd as part of his PhD work (titled Mutation Analysis) in 1980 from Yale University."

As I said earlier, Mutation Testing is not of benefit in all cases The exercise of testing is about engendering confidence, not offering cast iron guarantees. As a technique to engender greater confidence, Mutation Testing is certainly of value. However, not all projects will require the degree of confidence that Mutation Testing brings. For some projects, the cost versus confidence balance will be tipped before Mutation Testing becomes appropriate.

Nonetheless, for those projects where a high degree of confidence is required, Mutation Testing certainly has a role to play.

Have you used Mutation Testing? Please let me know (through a comment) if you have, I'm keen to hear some experiences good or bad)