It's comparatively early days in its life cycle; it provides value for a significant set of customers, but it will benefit an ever larger population as it evolves and gets enhanced over time.
The key benefits as I see them are i) its handling of "big data", ii) its user friendly yet highly functional user interface, and iii) its ability to design a report once yet deliver the report through a variety of channels (including desktop, web and mobile).
The big data element is delivered through in-memory techniques that are incorporated in the SAS LASR Analytic Server. In essence, this means that you need to reserve a number of servers (on commodity "blade" hardware or on database appliances from EMC Greenplum and Teradata) for the purpose of providing the in-memory capabilities. Once the data is loaded onto the LASR server and copied into memory, users can explore all data, execute analytic correlations on billions of rows of data in just minutes or seconds, and visually present results. This helps quickly identify patterns, trends and relationships in data that were not evident before. There's no need to analyse sub-sets of your data and hope that they are representative of the full set of data.
The user-friendly interface is largely drag-and-drop in a similar style to the design of Excel pivot tables. There is a wide range of output styles such as tables, graphs, & charts, and these can be laid-out into a report and linked together for synchronised filtering, drilling, slicing and dicing. The current release incorporates regression analysis and correlations. I anticipate that future releases will soon after more functionality such as forecasting.
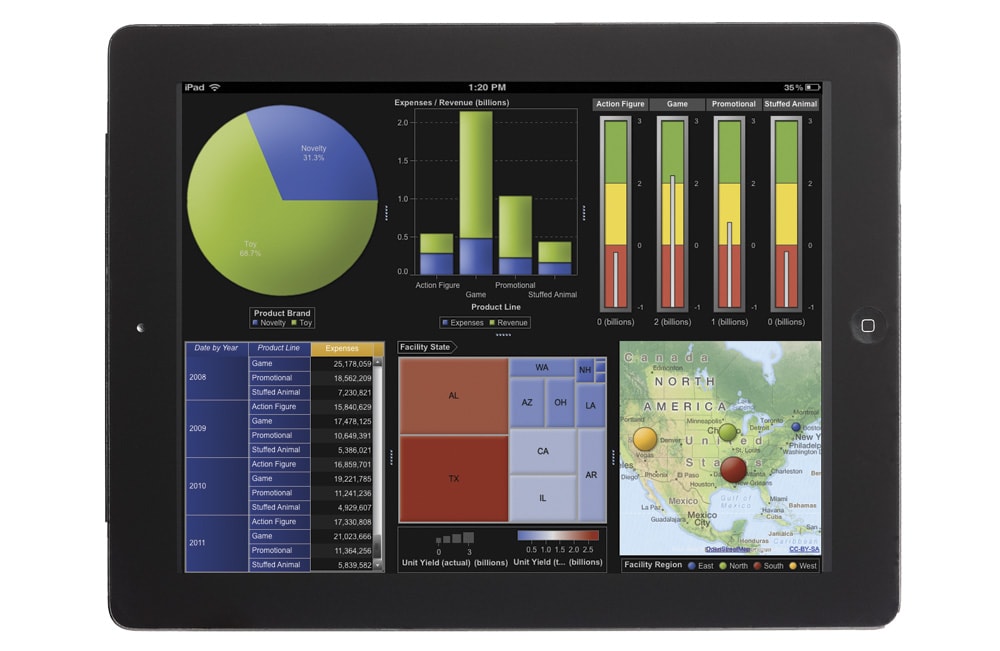
The reports that you design in Visual Analytics are simultaneously available through a number of channels including web, and mobile on iPad & Android. This means that your dashboards and reports are available to anybody, anywhere (combined with SAS security measures that make sure nobody sees any information that they are not meant to).
All-in-all, SAS Visual Analytics is another step in taking away the friction caused by technology limitations and allowing analysts to execute their analytical processes more effectively and efficiently. Less programming, more analysis, better results.